Once you have created a static or dynamic Account Based List, you can visualize the list to view its characteristics and to find recommendations of similar companies.
| Step | Description | Details |
|---|---|---|
| 1 | Log in to InsideView Apex | Log in to InsideView Admin Portal with user credentials. |
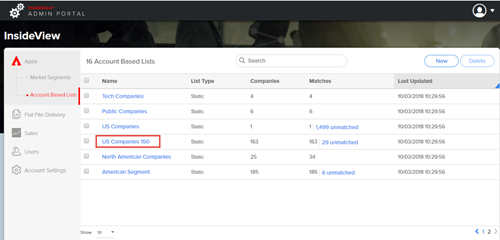
| 2 | Go to the List page | To visualize, click Apex and select the Account Based Lists link.
|
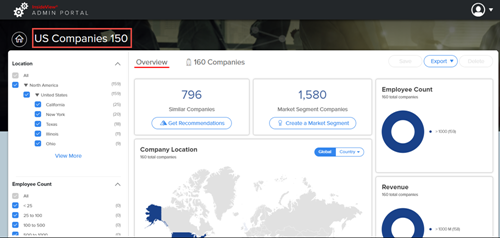
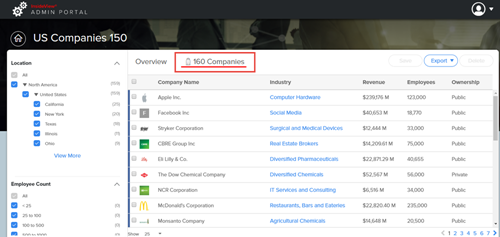
| 3 | Go to the list | Select the list that you want to view by clicking the Name link. For example, click the US Companies 150 link.
|
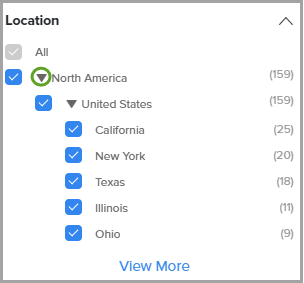
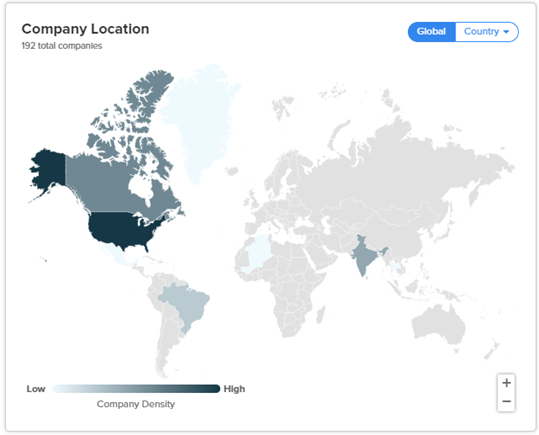
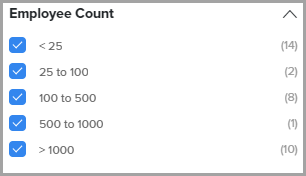
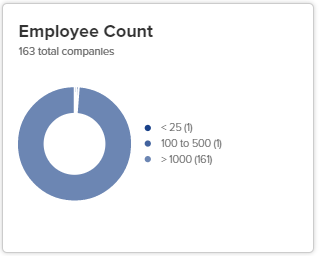
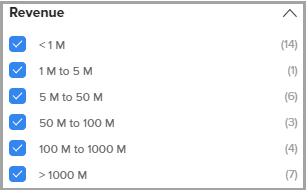
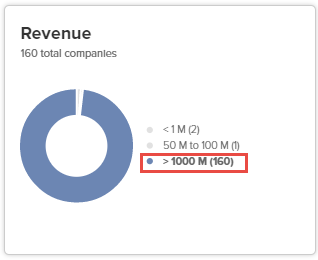
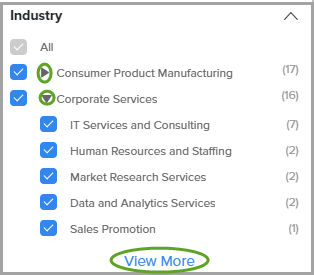
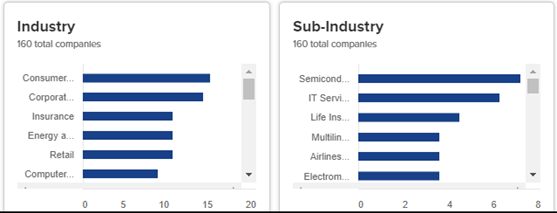
| 4 | Visualize the list | You can filter your lists by changing any of the following filters in the left pane or any visualization on the right:
|
| 5 | Visualize the company tab | Select the Company tab to view companies in the list. Select the check box beside company names to view their details as illustrated below: Click the Chevron Click Save to add companies to a new list or an existing list. For more information, read article Adding Companies to a List in our Knowledge Base. |
| 6 | Export or delete companies | Click Export to export companies to an .xlsx file.
or Click Delete to remove selected companies from the list. |
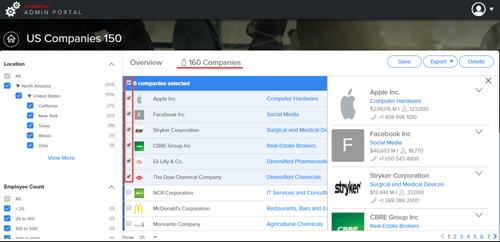
 icon to expand or collapse a company’s firmographic details.