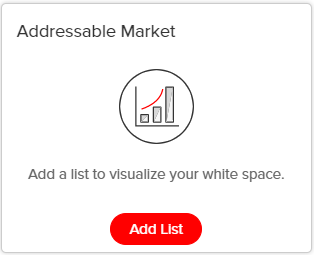
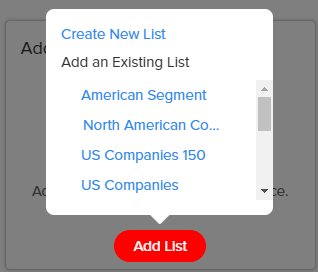
Once you have created a market segment, you can visualize companies or people and add lists of your current companies so that you can identify your market segment’s whitespace.
The whitespace in your market segment is the unexplored list of companies available in InsideView, which is pulled when you add a list of your existing customers. The whitespace shows size of opportunities that are available in your segment. This whitespace can be quite helpful for you to find the right companies for business dealings.
Here’s how you can visualize a market segment:
| Step |
Description |
Details |
| 1 |
Log in to InsideView Apex |
Log in to InsideView Admin Portal with user credentials. |
| 2 |
Select a Market Segment type |
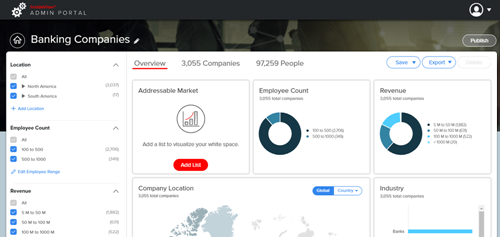
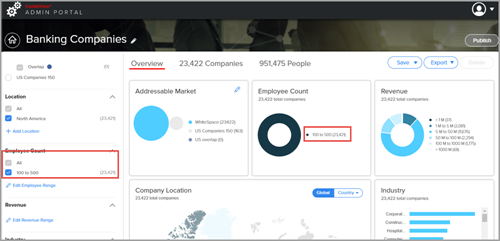
Click Apex and select the Market Segments link and click on the Banking Companies segment.
|
| 3 |
Visualize the Overview tab |
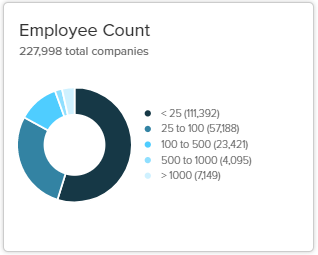
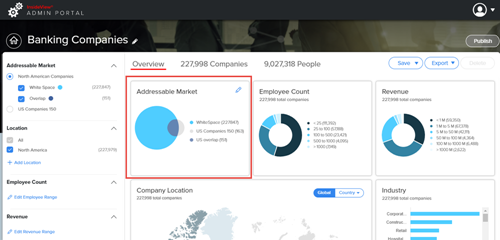
Select the Overview tab to view the following information:
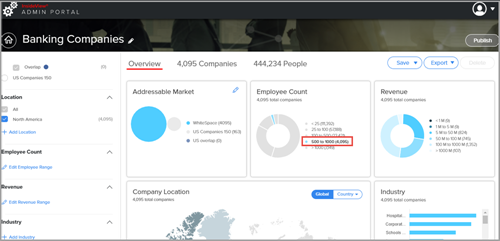
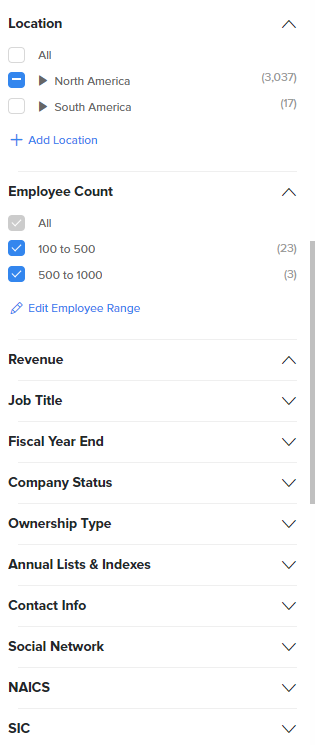
Employee Count
Revenue
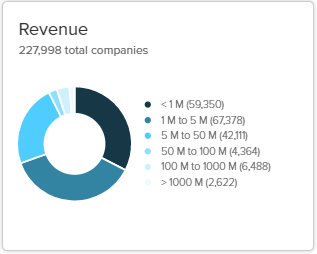
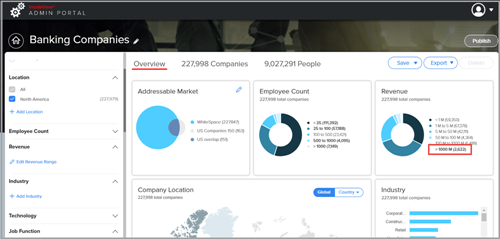
- To filter your search results by revenue, click on any revenue range in the visualization or left pane.
- For example, select greater than 1000 M (10000 M) to filter your results down to 2,662 companies.
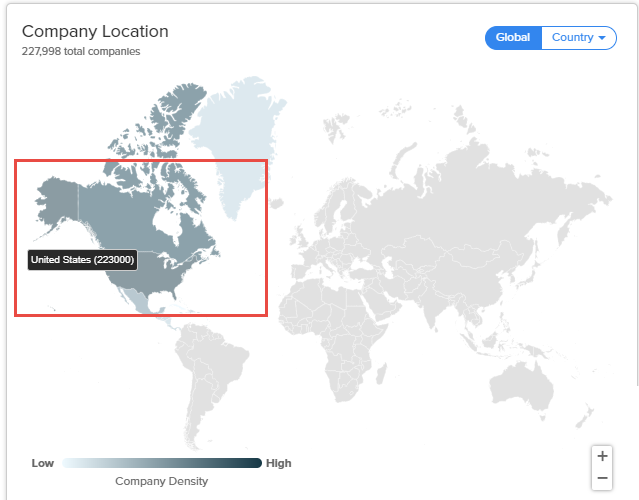
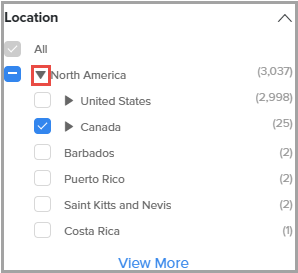
Location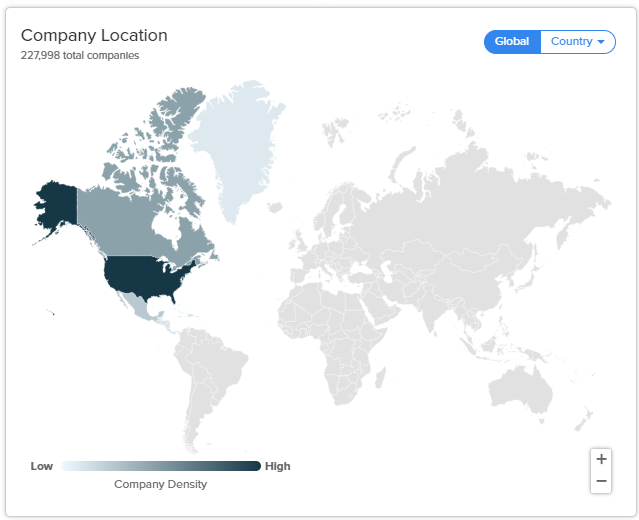
Industry
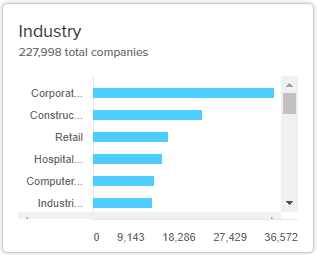
- If you have multiple industries in your segment, you can click on any industry type to filter results.
Sub-Industry
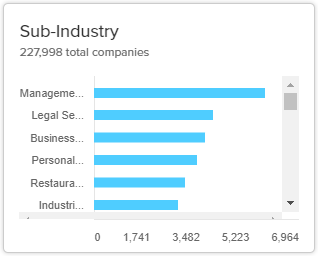
- Click on any sub-industry in this region to filter results with your selection. For example, click the IT Services sub-industry option as illustrated below:
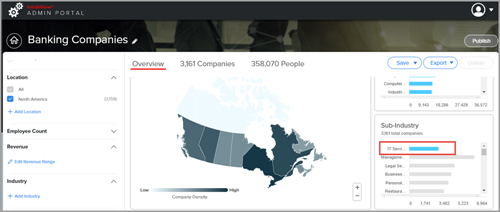
- Notice screen above and see the results are filtered to display 3,161 companies with IT Services as sub–industry.
Job Function
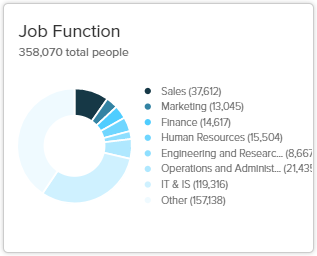
- Select the Sales option in the Job Function region to view executives with sales as their job role.
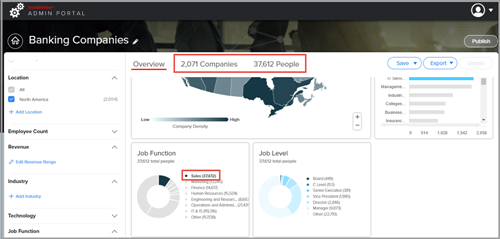
- Notice the donut chart shows only 37,612 executives with sales as their job function in 2071 companies.
- You can select any job function to filter companies and people in your market segment.
Job Level
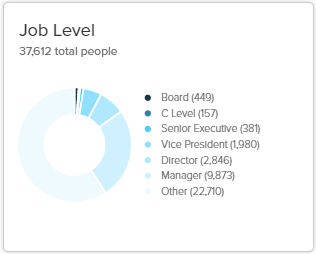
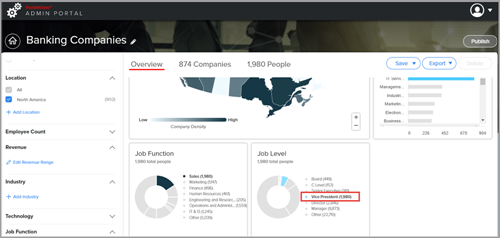
- Select the Vice President option in the Job Level region to filter executives with VP designation in their job title.
|
| 4 |
Visualize the Companies tab |
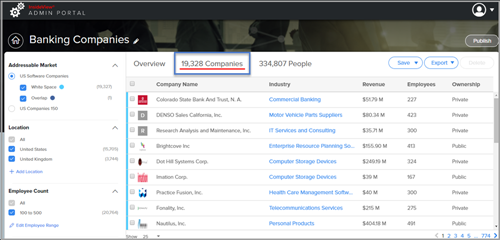
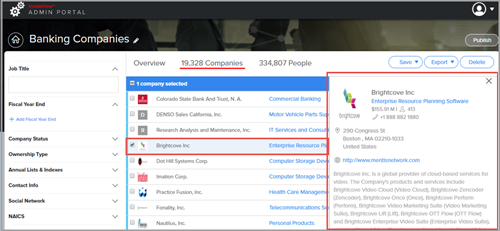
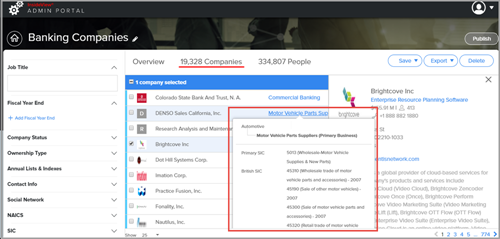
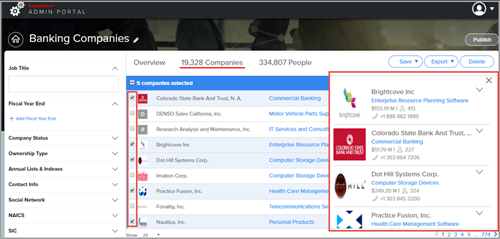
The Companies tab shows you the list of companies in your market segment.
|
| 5 |
Visualize the People tab |
The People tab displays the number of people that you can view in your target market segment.
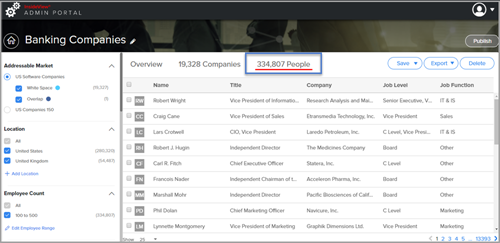
- Select or deselect filters in the left pane to identify the right executives in your market segment.
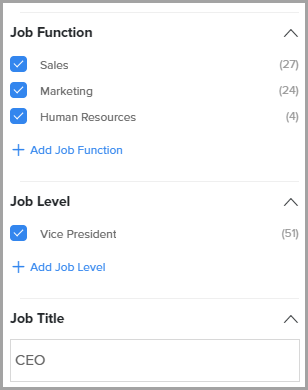
- Select the check box for an executive to view details of that particular contact as illustrated below:
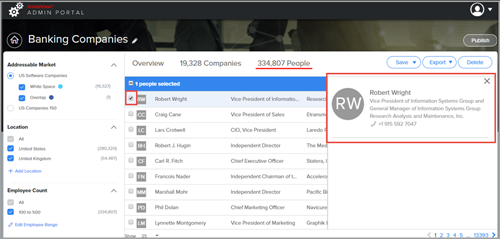
- You can select multiple executives to view their details.
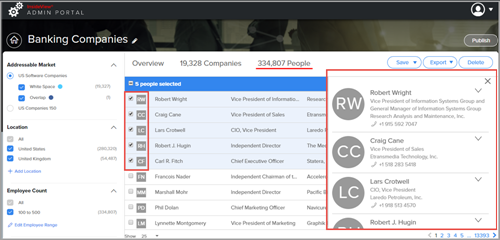
- To expand and collapse the contact’s detail click the
 icon in the right pane. icon in the right pane.
- Click Delete to remove selected executives from your market segment.
- Click Export to export selected executives in an .xlsx file.
|
| 6 |
Save |
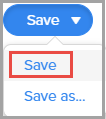
Click Save to save all changes that you made in the market segment cards.
|






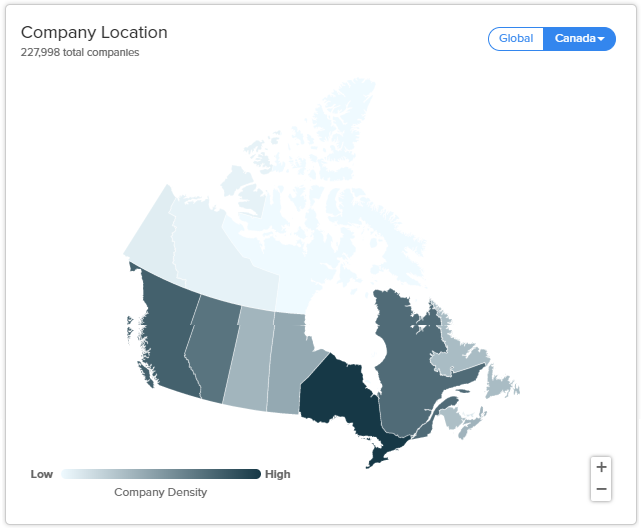
 icon to expand the Location to view and select the other locations.
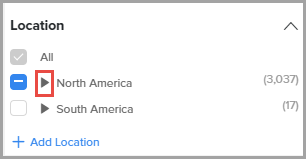
 again to close the location view.




 icon in the right pane.