InsideView Apex lets you view analytics of sales pipeline and opportunities within your market segments from your Salesforce CRM within your market segments. Additionally, the Apex Analytics dashboard shows only lead analytics for Microsoft Dynamics CRM, Eloqua and Marketo Marketing Automation (MA) integrations. It lets you visualize the performance of published market segments against sales win or loss, leads and opportunities over a period of time interval.
Note: In order to view Apex Analytics dashboard, you must install to the latest InsideView unified package and configure an application or integration user based on your CRM integration to establish a communication channel for data aggregation. For more information, read these articles
- Best Practices for Creating an Integration User in Salesforce CRM
- Creating an Application User for Microsoft Dynamics Integration
- Upgrading to the InsideView Unified Package to View Apex Analytics Report
Here’s how you can view Apex Analytics dashboard:
| Step | Description | Details |
|---|---|---|
| 1 | Log in to InsideView Admin Portal | Log in to InsideView Admin Portal with user credentials. |
| 2 | Go to Apex | Click the Apex link.
The Apex Analytics Dashboard below shows both lead and sales opportunity analytics:
Notes:
|
| 3 | View Apex analytics | In the Apex Analytics Dashboard, you can view analytics of sales revenue, leads and opportunities data and you can analyze it using the following options:
Note: These options are contextual and change as per the date range selected. For example, if you select the Year option, you cannot group the data by Week. |
| 4 | Check Apex Analytics | In the Aggregate view, you will see aggregation of data analysis for sales revenue, leads and opportunities from all market segments
In the Comparison view, you will see the comparison data of each market segment for each segment with lead/open opportunities and closed opportunities:
|
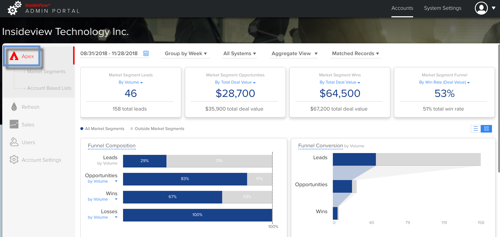
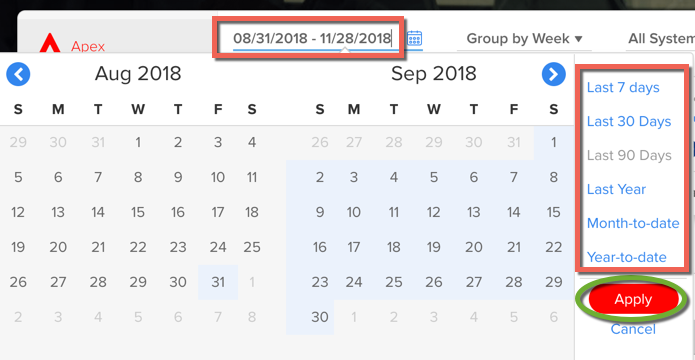
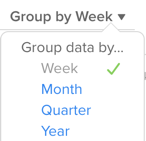
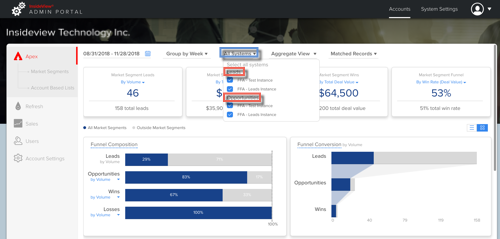
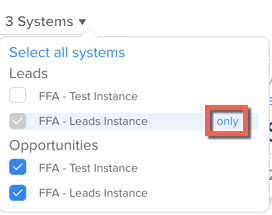
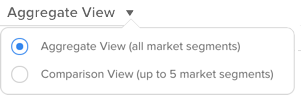
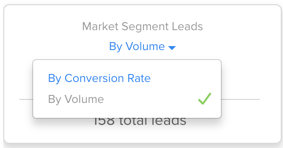
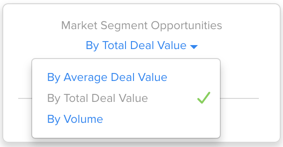
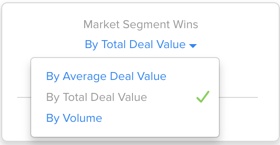
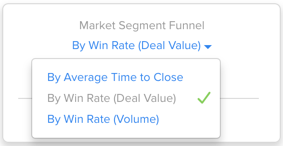
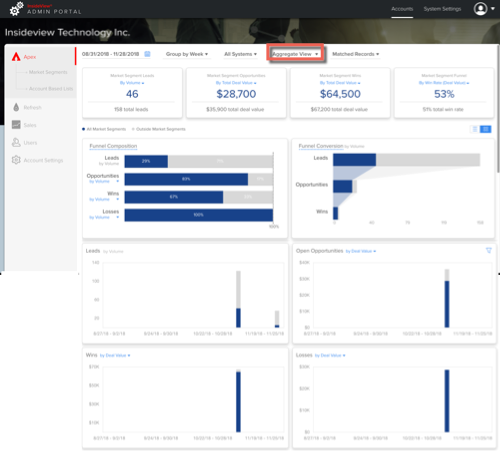
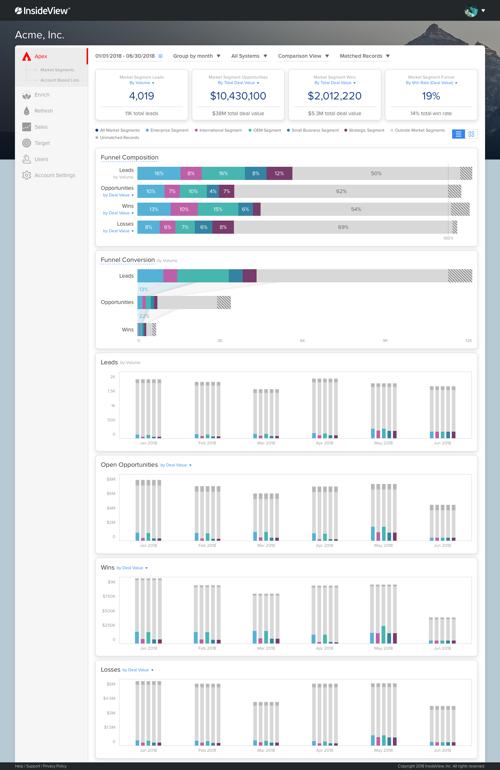
Table: Apex Analytics Data Analysis
The Apex Analytics data is an aggregate information for market segment leads, opportunities, wins, and the complete sales pipeline. Each snapshot card has its own options to change what data is being shown:
| Card Name | Description and Options | Data View |
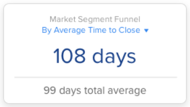
| Sales Pipeline | Number of days to close an opportunity from the creation date.
Choose any one of the following options:
|
|
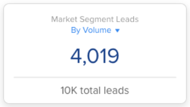
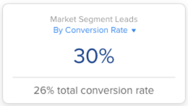
| Leads | Total number of leads in a market segment.
Choose any of the following options:
|
|
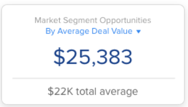
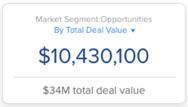
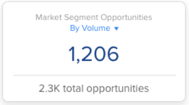
| Opportunities | Total number of open opportunities associated to a market segment
Choose any of the following options:
|
   |
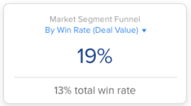
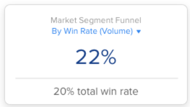
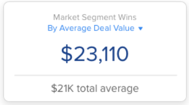
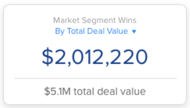
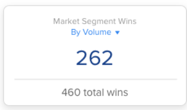
| Wins | Total number of wins in a market segment Choose any of the following options:
|
   |